Documentación Esta documentación se aplica solo a iceScrum v7.
Para el antiguo iceScrum R6, lea la documentación o migrate.
-
Instalar o Actualizar
-
Para empezar
-
Características principales
Apps & integraciones
Neatro
Companion
MURAL
Microsoft Teams
Discord
iObeya
Zoom
Google Hangouts Meet
Jamboard by Google
Miro
Jitsi Meet
Mattermost
Custom project dashboard
Agile KPIs
Webhooks
Forecast
Agile fortune
SAML Authentication
Labels
Share
Zapier
Story workflow
FeatureMap
Time tracking
Diagrams & mockups
Epic stories
Portfolio
Roadmap del proyecto
Toolbox
Autenticación externa
Integración continua
Almacenamiento en la nube
Capacidad del equipo
Bug trackers
LDAP / Active Directory
Slack
Administración de proyecto
User administration
Server administration
Git & SVN
Exportación de datos
Mood
Importación Excel
Responsable de tarea
Voto de historia
Plantilla de historia
Apps & integraciones
Pilas personalizadas
-
Migración
-


More advanced indicators (such as Lead Time and Cycle Time) to improve inspection and adaptation.
Agile KPIs
Out of the box, iceScrum offers a wide choice of agile indicators that you may expect a good agile tool. When your license allows it, this App is enabled by default and offers additional indicators available as widgets that you can add to your dashboards. There are great tools to incorporate in your team’s toolbelt in order to improve inspection and adaptation.
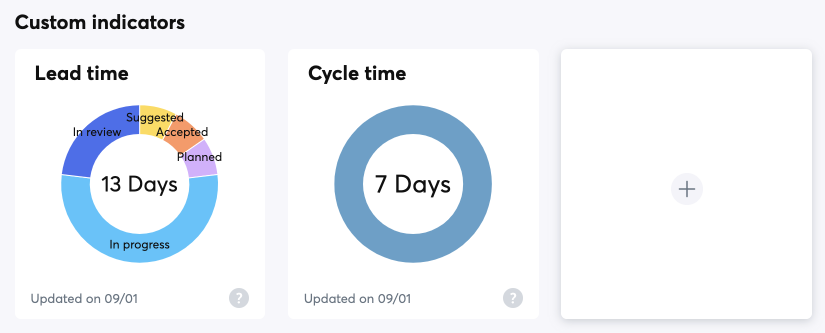
Cycle time (Stories)
In iceScrum, the Cycle Time is the average time taken for a story from the moment the team starts working on it until it is completed. It is often used in Lean / Kanban, but it can be a great addition to Scrum as well as it encourages improving the flow of stories and reducing bottlenecks and stocks.
The moment a team starts working on a Story is deduced from its tasks: it is the moment its first task is marked as «In progress». The completion date is the moment a story is marked as «Done».
Data is gathered on done stories, for a period of one and a half months before the last story has been marked as «Done».
This indicator is meaningful only if the team splits stories into tasks and update them on a regular basis.
Ideally, you want the Cycle Time to be significantly lower than a sprint duration, which means that stories are delivered at a regular pace and that the team does not suffer from the «tunnel effect» during sprints.
Lead time (Stories)
In iceScrum, the Lead Time is the average time taken for a story from the moment it is defined until it is completed. It is often used in Lean / Kanban, but it can be a great addition to Scrum as well as it encourages improving the flow of stories and reducing bottlenecks and stocks.
The moment a story is defined may vary depending on what you mean by «Defined», that is why you may choose among three dates as the starting point: it’s either the moment a Story is «Suggested», «Accepted» or «Estimated». The completion date is the moment a story is marked as «Done».
Data is gathered on done stories, for a period of one and a half months before the last story has been marked as «Done».
Ideally, you want the Lead Time to be as short as possible, as it represents the time taken to answer a need that has been expressed. The Lead Time is broken down into the time spent at each state in between so you can identify bottlenecks and take appropriate action.
Throughput (Stories)
In iceScrum, the Throughput is the number of stories completed per rolling week. It is often used in Lean / Kanban, but it can be a great addition to Scrum as well as it encourages improving the flow of stories and reducing bottlenecks and stocks.
It is calculated only for the current release, as it is meaningful only for continuous periods of work. It is averaged up to a 4 weeks range if data is available in the current release.
For this indicator to be meaningful, it requires that stories are completed on a regular basis. It also requires that stories are roughly the same size as the effort is not taken into account.
Ideally, you want the Throughput to be high, which means that there is a great flow of completed stories and little tunnel effect.